R-CAT: Riparian Condition Assessment Toolbox > R-CAT Applications >
Utah Implementation
The Need for Statewide Riparian Mapping, Condition Assessment and Recovery Potential Products
- Riparian areas provide critical habitat for the majority of Utah’s wildlife.
- Effective and efficient wildlife management requires accurate and comprehensive riparian zone mapping and assessment.
- Riparian habitat extent and condition can be used to strategically prioritize conservation and restoration projects.
- Riparian recovery potential maps can help prioritize restoration sites and can help develop realistic restoration goals.
Closing the Riparian Data Gap
Until now, for most of Utah, adequate riparian habitat maps describing extent, condition and recovery potential were lacking. In 2013, in an effort to close this data gap, the Bureau of Land Management (BLM) in conjunction with Utah State University’s Department of Watershed Sciences began a project to delineate riparian areas throughout the Colorado Plateau Ecoregion that includes the eastern half of Utah. In 2014, a project supported by the Utah Endangered Species Mitigation Fund (ESMF) extended this riparian area mapping effort to include the western half of Utah’s perennial stream and river network. In 2015, the Utah Division of Wildlife Resources (UDWR) Pittman-Robertson Wildlife Restoration Act (PR) funds was used to further refine and extend riparian condition assessment and recovery potential products statewide.
2013-2014 BLM Funded Riparian Mapping Project
The BLM funded study resulted in delineation of all valley bottoms for the Colorado Plateau Ecoregion (Figure 1 and Figure 2).
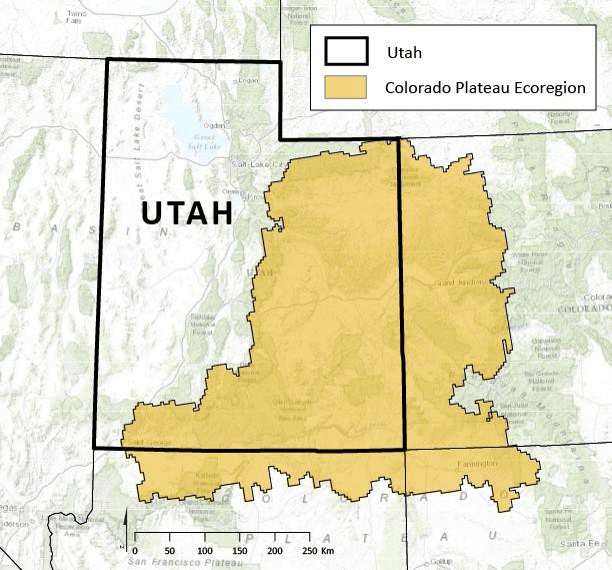
Figure 1 - The study area for the Bureau of Land Management project was the the entire Colorado Plateau Ecoregion.
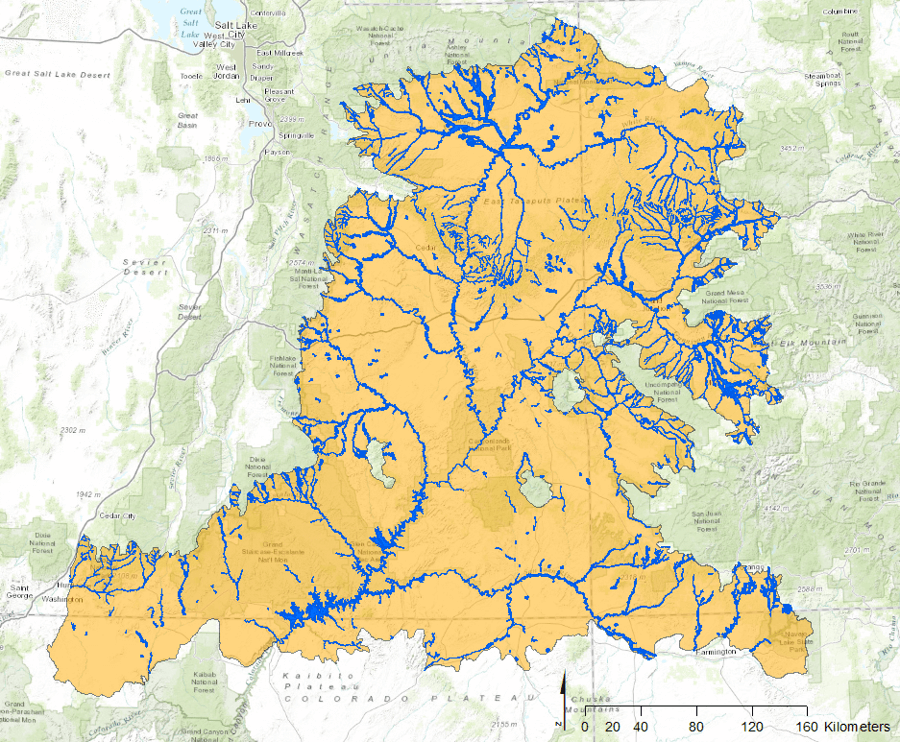
Figure 2 - Example of spatially variable valley bottom delineation for the Colorado Plateau Ecoregion. The valley bottom sets the template for maximum riparian extent.
The project also resulted in the initial development of the Riparian Vegetation Departure index (RVD). RVD is a ratio that is similar to the ‘observed’ to ‘expected’ (‘O/E’) type metrics used in environmental condition assessments. RVD characterizes riparian vegetation condition for a given stream reach as the ratio of existing vegetation to an estimation of pre-European settlement vegetation coverage (Figure 3). To numerically calculate condition, native riparian vegetation is coded as ‘1’ and invasive and upland classes are coded as ‘0’ in both the existing, and pre-European settlement vegetation rasters and condition is calculated as the ratio of current to historic native riparian coverage for a given reach.
To support reach-level assessments, we bound the lateral extent of our analysis by generating analysis polygons within the valley bottom. Analysis polygons are generated in three steps. First, each valley bottom unit is split into a series of Thiessen polygons, with centroids located at the midpoint of each stream segment (Figure 3). Second, the valley bottom is buffered by the pixel resolution of the vegetation data (i.e., 30-m vegetation data is buffered by 30 m) to ensure that the relevant vegetation data is completely contained within the valley bottom in headwater reaches (Figure 3). Finally, we clip the Thiessen polygon layer to the buffered valley bottom. The resulting polygons become the analysis features for which the RVD tool calculations are summarized (Figure 3).
Within each polygon, the mean of the values (i.e. the 1s and 0s) is calculated for both the existing and historic vegetation layers, resulting in values that represent the proportion of each polygon with native riparian cover (Figure 3). The final processing step is to apply the RVD calculation from the analysis polygons to reach segments and divide the historic proportion by the existing proportion (Figure 3). Low values (closer to 0) signify large departures from historic riparian coverage whereas high values (i.e., approaching or exceeding 1.0) denote that riparian communities are relatively intact (or even increasing). To facilitate output display we symbolize each reach based on departure from historic cover, defined as the calculated ratio subtracted from one, which results in a percent departure. We categorize ‘negligible departure’ as less than 10%, ‘minor departure’ 10% to 33%, ‘significant departure’ 33% to 66% and ‘large departure’ > 66%. The quality of this ratio depends both on the accuracy of the vegetation coverage datasets, and the appropriateness of the spatial scale (i.e., reach) at which calculations are made, relative to input data resolution.
In the Utah statewide application RVD used LANDFIRE Existing Vegetation Type (EVT) data and Biophysical Settings (BpS) data to estimate riparian vegetation change since Euro-American settlement at a reach level (500 m segments). The BpS layer spatially explicitly models what vegetation communities would likely occur in a specific location based on physical conditions (e.g. soils, elevation, aspect, moisture, and natural fire regime). We used the BpS layer to represent the reference (pre-settlement) vegetation condition and the EVT layer was used to represent the current (2012) vegetation condition (Figure 3). The vegetation condition assessment treats the valley bottom as the maximum probable riparian extent and contrasts existing riparian vegetation to predicted historic vegetation to estimate a score that represents the current proportion of historic native riparian vegetation cover still existing today (Figure 4).
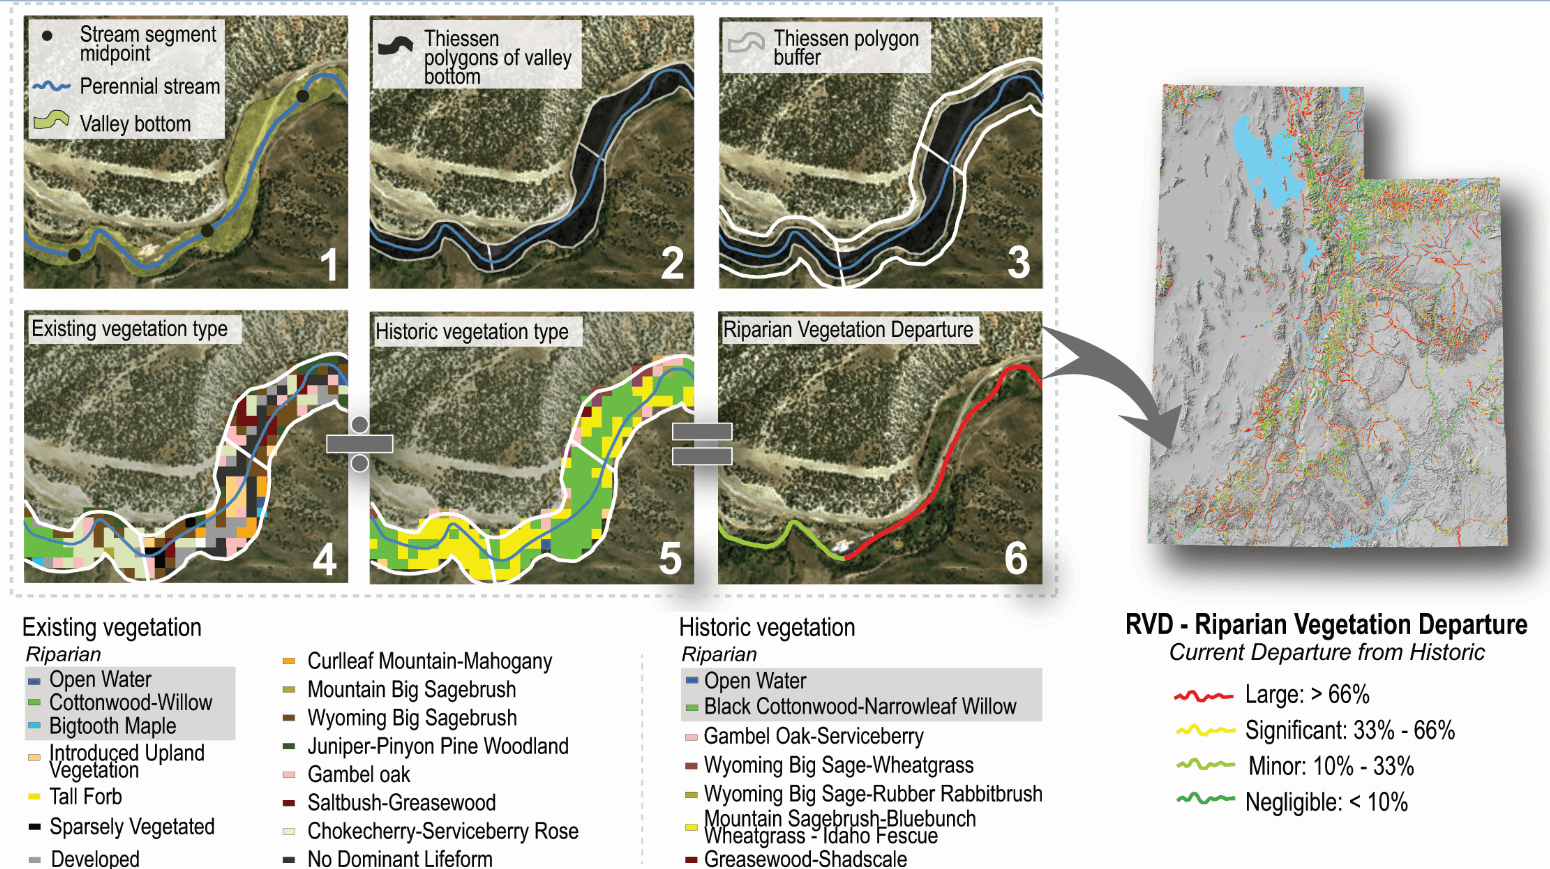
Figure 3 - A conceptual diagram of the riparian vegetation departure index showing how mid points of the drainage network (1) are used to generate Thiessen polygons (2) and how these polygons are buffered by the resolution of the vegetation data to ensure that vegetation data is completely contained within the valley bottom in headwater reaches (3). Riparian vegetation departure is calculated using the ratio of existing area of native riparian vegetation (4) to historic area of native riparian vegetation (5) and the output is a segmented drainage network containing riparian departure from historic condition scores (6).
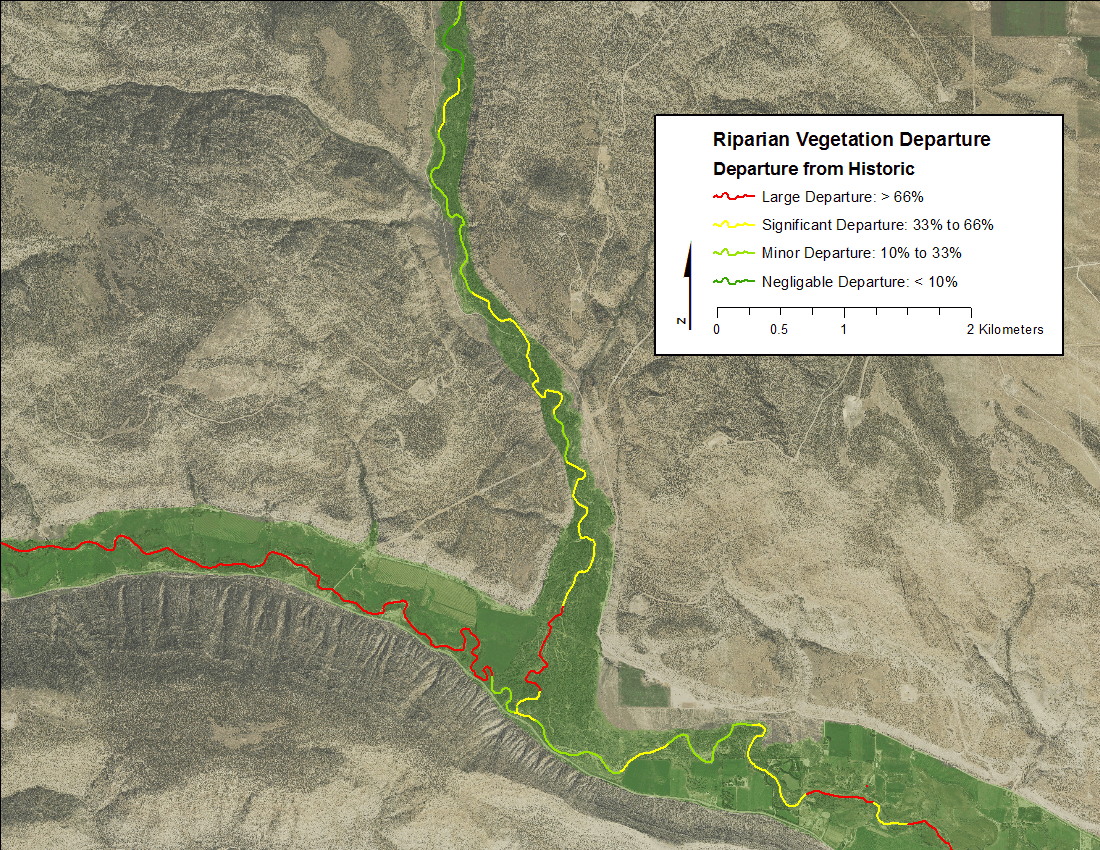
Figure 4 - An example of a valley bottom (green) and classified segments of the underlying NHD stream network into riparian vegetation departure from historic condition categories.
2014-2015 Utah Endangered Species Mitigation Fund (ESMF) Funded Riparian Mapping Project
In the study funded by ESMF, we extended the valley bottom delineations and Riparian Vegetation Departure from historic to the western half of Utah (Figure 5).
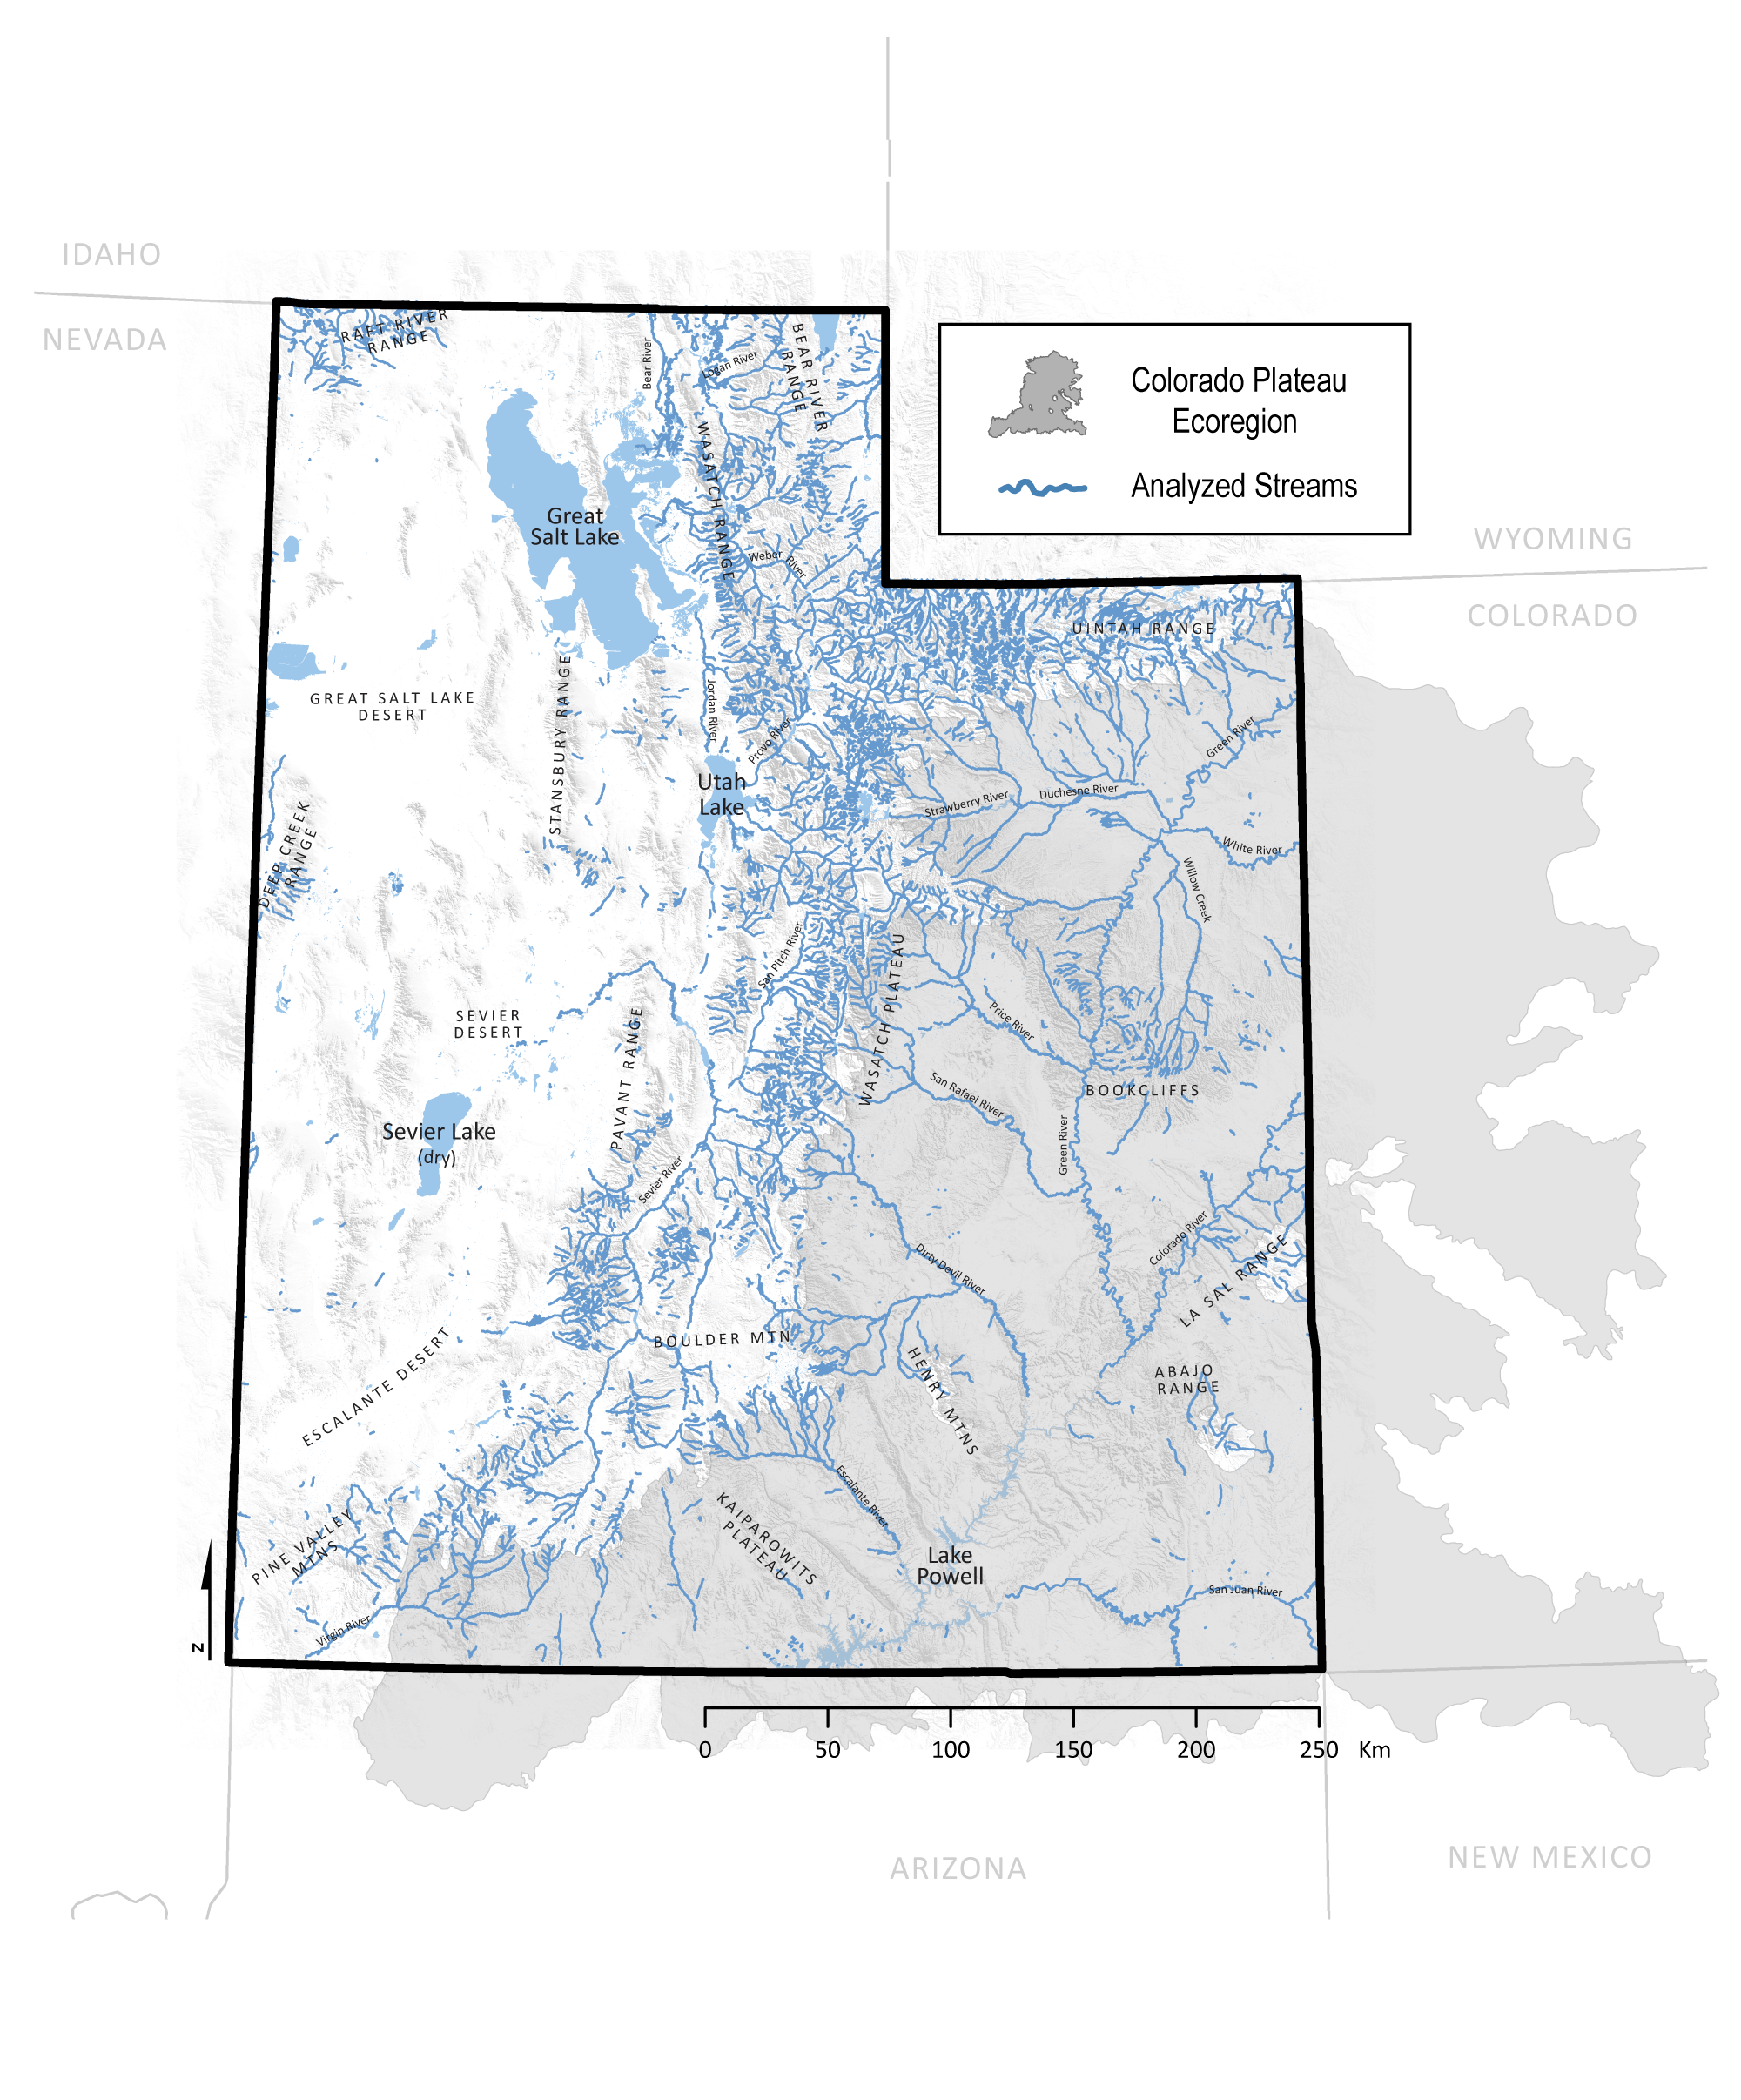
Figure 5 - Extending valley bottom delineation and Riparian Vegetation Departure to the western half of Utah.
Results and Benefits
The BLM and ESMF projects combined include all 25,685 kilometers of perennial streams and rivers across the entire state of Utah. The resulting consistent and seamless statewide riparian area and Riparian Vegetation Departure for historic condition maps and associated GIS layers are useful for conservation, restoration and mitigation planning (Figure 6). The Riparian Vegetation Departure from historic provides an important baseline to compare current and historic condition. This information can be used to monitor ecological responses to natural and anthropogenic disturbances and can be used to inform land-use decisions and monitor mitigation/restoration efforts.
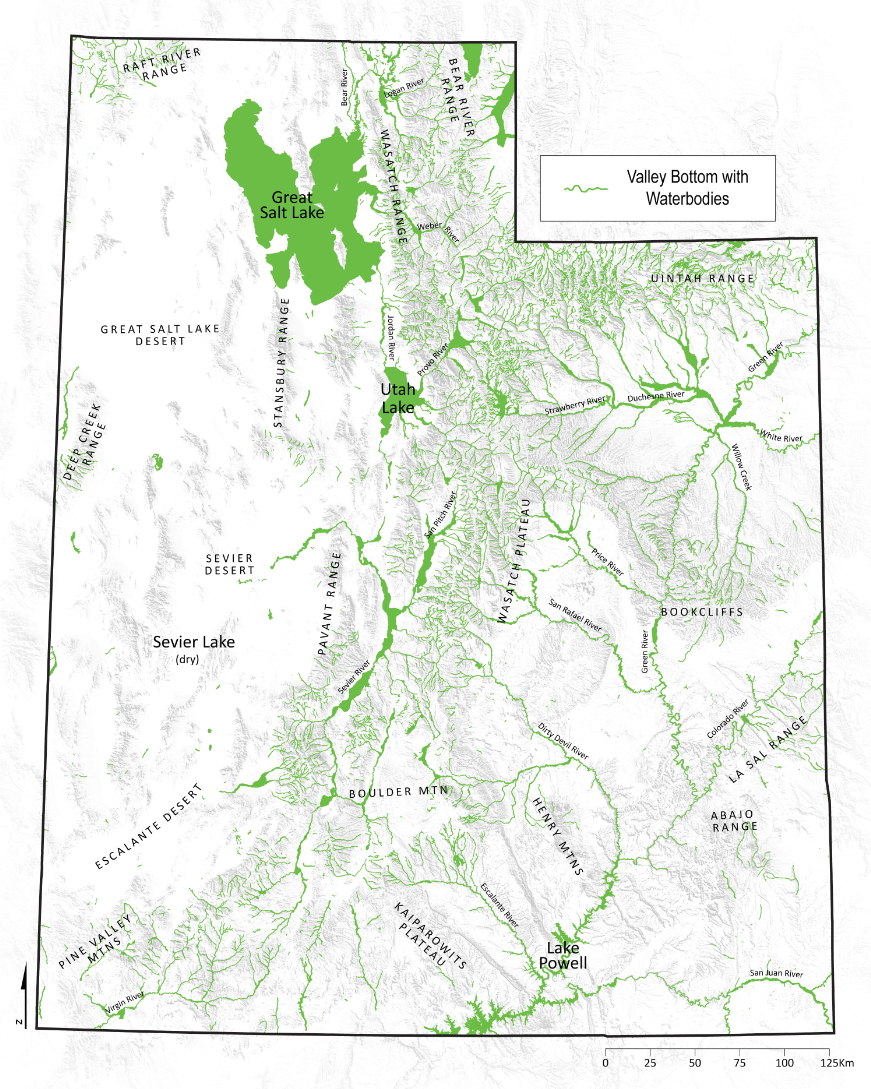
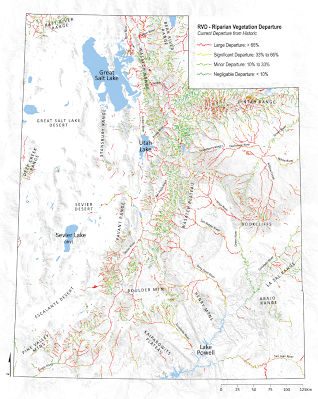
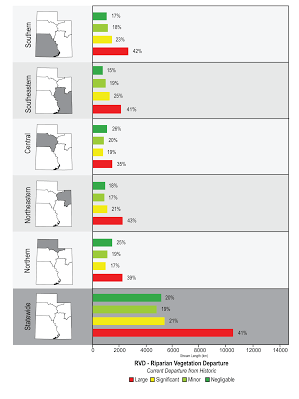
Figure 6 - Statewide valley bottom delineation (left) and statewide Riparian Vegetation Departure from historic condition map (middle) and statewide Riparian Vegetation Departure from historic condition bar chart (right).
Riparian Vegetation Departure Classification Accuracy for the Weber Watershed
Within the Weber River watershed of Northern Utah, field verification was performed to validate the output of the RVD tool. 31 randomly selected sites were visited and surveyed. These field visits, combined with aerial imagery were used to estimate current native riparian cover for each of the sites. This was then compared with the modeled historic riparian vegetation cover to calculate a departure in the same way that the tool does. The departure categories from the field visits were compared to those from the output of the automated tool. An error matrix shows the results of this comparison (Table 1).
Table 1 – Riparian Vegetation Departure Validation Error Matrix and Cohens K Score for Weber watershed random plot assessment.
Riparian Vegetation Departure (RVD) tool output
| Field Data | ||||||||
| Large | Significant | Minor | Negligible | Row Total | Producer Accuracy | Omission Error | ||
| Large | 14 | 14 | 100% | 0% | ||||
| Significant | 3 | 3 | 100% | 0% | ||||
| Minor | 2 | 4 | 6 | 67% | 33% | |||
| Negligible | 1 | 2 | 5 | 8 | 63% | 38% | ||
| Column Total | 14 | 6 | 6 | 5 | 31 | |||
| Consumer Accuracy | 100% | 50% | 67% | 100% | ||||
| Commission Error | 0% | 50% | 33% | 0% | ||||
| Overall Accuracy | 84% | |||||||
| Cohens K | 0.77 |
An overall map accuracy of 84 % as established based on the 31 accuracy assessment plots. A Cohen’s Kappa statistic, which adjusts for chance agreement, was calculated to rate agreement between the tool and manual observations. The calculated Cohens K was 0.77. A Cohen’s K from 0.61 to 0.8 indicate substantial agreement.
Deliverables
The BLM and ESMF funded products (as maps, KMZ, shapfiles) include:
- Utah-wide riparian area delineation (valley bottoms) for all NHD perennial streams and rivers https://usu.box.com/ValleyBottoms
- Utah-wide Riparian Vegetation Departure (RVD) from historic condition https://usu.box.com/RiparianVegetationDeparture
2015 Pittman-Robertson Wildlife Restoration Act (PR) funds Riparian Condition and Riparian Recovery Potential Project
Study Area and Methods
The study area covers the entire state of Utah (figure 7, and the West Desert was the focus of pilot efforts to extend from the perennial network to the intermittent stream network, as well as springs (Figure 7). The Weber River watershed was the focus of an independent analysis of condition using the River Styles Framework (Figure 7).
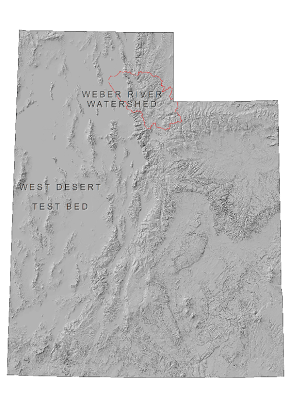
Figure 7 - Map show the West Desert were intermittent streams and springs were assessed and the Weber River watershed were the independent River Styles Framework was applied.
In the Pittman-Robertson Wildlife Restoration Act (PR) funded project, we produced the Riparian Condition Assessment that extended the Riparian Vegetation Departure from historic condition by also calculating land use intensity and floodplain fragmentation due to transportation infrastructure. During the project, we also developed the Riparian Vegetation Conversion Type tool and the Riparian Recovery Potential tool. The Riparian Vegetation Conversion Type tool examines the causes of riparian loss and/or degradation and differentiates between degradation driven by land use conversion (e.g. to agricultural or urban), invasive species encroachment, or encroachment by upland species (typically due to less water availability) (Figure 8). The Riparian Recovery Potential tool infers riparian recovery potential by looking at the plausibility and extent to which historic or healthy riparian conditions can be recovered within the valley bottom. For example, a system in which the valley bottom has been converted to urban has minimal recovery potential, whereas a valley bottom that has been broken up by a road or railroad may have limited recovery potential, and a valley bottom that is still intact but has been degraded with invasive vegetation or by grazing land uses may have moderate to high recovery potentials. In addition to vegetative lines of evidence, we relied on land use, land ownership, and infrastructure layers.
West Desert Springs and Intermittent Streams
Riparian areas critical to many upland species (e.g. chuckar, greater sage-grouse, and mule deer) include not just those along perennial streams, but also riparian areas surrounding intermittent streams, springs and wetlands. Particularly in the most arid parts of the state (e.g. the West Desert), the importance of all riparian areas as zones for foraging, cover from predation, a water source and as migration corridors is difficult to overstate. As such, we extended the riparian condition analyses to springs and intermittent streams in the West Desert. Using a newly developed USGS model, drainage network information for intermittent streams was vastly improved. Once this new intermittent stream layer was established, valley bottoms were derived for these areas, and the riparian analyses performed. By contrast, spring locations are not always dependable within the Nation Hydrography Dataset (NHD) data. Consequently, our efforts relating to springs were focused on developing methods to accurately assess the reliability of the occurrence of springs rather than performing a full condition analysis. The assessment was a manual process where the NHD springs dataset was compared to other datasets to find overlap/agreement which allowed the formation of confidence levels that could be attributed to each point. There were a total of four confidence levels attributed to the data. 0= NHD has no overlap with any other dataset, and the point isn’t named. 1= The NHD point is either named, or is unnamed but has overlap with at least 1 other dataset. 2= The NHD point is named and has overlap with 1 other dataset, or is unnamed and has overlap with the 2 other datasets. 3= The NHD point is named and has overlap with the 2 other datasets. These other datasets include the combination of NWI with Utah Water Related Land Use and the combination of NWIS and WRPOD. They were combined because where one of the datasets was lacking in spatial coverage the other filled in the gaps, which allowed for more spatially complete dataset. Points from each level were then randomly sampled and validated using high resolution aerial imagery, the points assessed are noted in the VALIDATED field in the attribute table (this field can be used to note future validated points and how they were validated i.e. aerial imagery, ground based). The randomly sampled and validated points were then analyzed using a chi-squared test as well as a spearman rank correlation. The chi-squared test revealed that there is a significant difference in the likelihood of a spring being at each site across the levels of confidence. The rank correlation test resulted in the decision that there’s an increasing likelihood that you will find a spring as you increase across the levels of confidence. This analysis only examines spring presence not the spatial accuracy at which the spring was mapped. The analysis showed that if the NHD springs feature class indicates that a spring exist then there is a high likelihood that an actual spring does exist in the area, but it may not exist at exactly the specified location.
Independent Testing and Comparison of Condition and Recovery Potential
In the Pittman-Robertson Wildlife Restoration Act (PR) funded project we independently tested the riparian condition and recovery potential assessment methods against the River Styles Framework (RSF) methods developed by Brierley and Fryirs (2005) for assessing current condition and recovery potential. We performed a complete condition and recovery potential assessment using the RSF for the Weber River watershed. The RSF is explained in more detail here but is essentially a vetted method for conducting geomorphic assessments which provides tools for interpreting river character and behavior, geomorphic and riparian condition, and recovery potential. (e.g. O’Brien and Wheaton 2015). Furthermore, the RSF relies on extensive field validation. Thus, it provided an excellent, robust test of the quality of the outputs produced by the new methods developed as part of this project. We used those insights to refine and calibrate the outputs. The advantages to the methods being developed in this project are that they are scalable and can be run more efficiently at broad (statewide) levels from nationally available datasets. The results from the comparison are presented here and are also included in the Weber River Styles Report.
Results and Benefits
This project resulted in important statewide riparian area baseline maps and GIS layers. This uniform and comprehensive knowledge of the actual extent, distribution, condition and recovery potential of this key wildlife habitat will enable better riparian habitat threat abatement, conservation planning, and the prioritization of restoration planning and implementation. The riparian area condition assessment provides resource managers with an essential baseline for the establishment of current status of habitat and for monitoring trend over time. The Riparian Vegetation Departure from historic helps contextualize the extent of what has been lost, and the recovery potential can be used to guide restoration options in what is realistically achievable as opposed to just the nostalgia of what once was there. The baseline assessment of recovery potential helps identify areas where restoration may be a viable option to recover riparian areas and differentiate between situations that may result in ‘quick returns’ versus those that will require a longer-term investment. These baseline products were rigorously validated and tested using a mixture of ground-truthing, comparison to independent assessment using accepted techniques, and sensitivity to the spatial resolution and quality of the inputs (Figure 9). These products can be used by UDWR managers to set more realistic strategic plans and policy leveraging the power and context of accurate, end-to-end mapping across the state (Figure 10 and Figure 11).
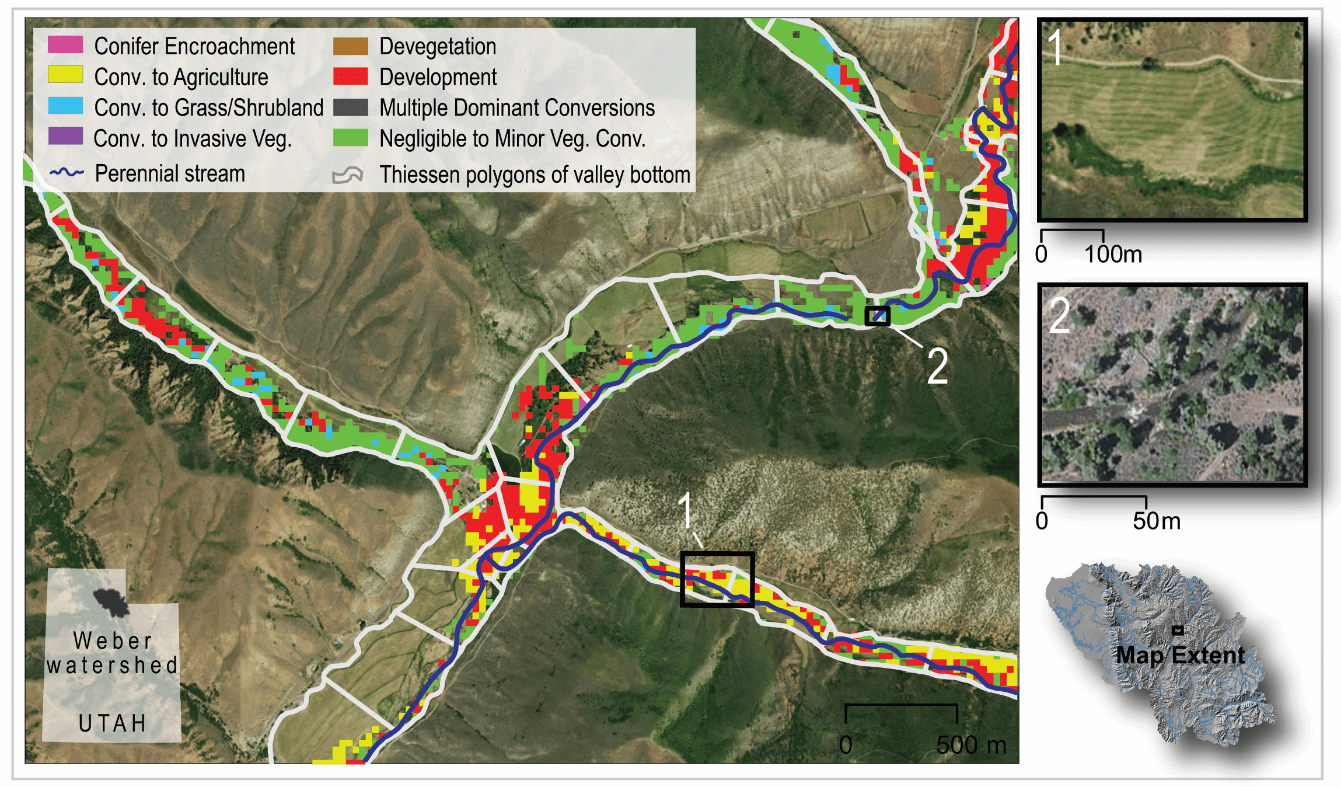
Figure 8 - Conceptual diagram showing the Riparian Vegetation Conversion Type tool outputs in the Weber River watershed.
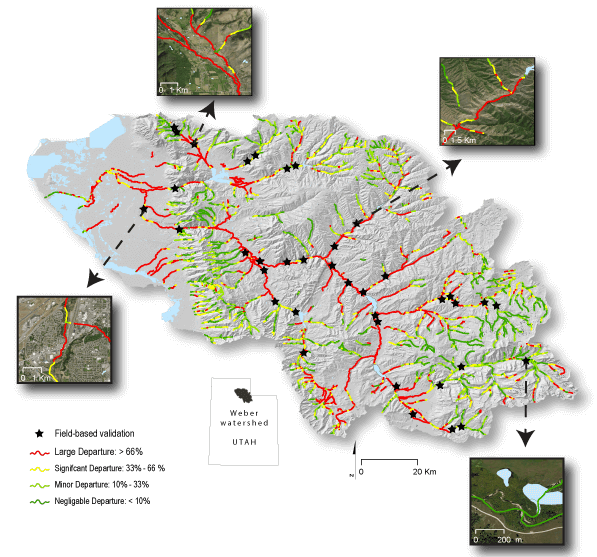
Figure 9 - Weber River watershed showing field based validation locations of the Riparian Vegetation Departure from historic condition.
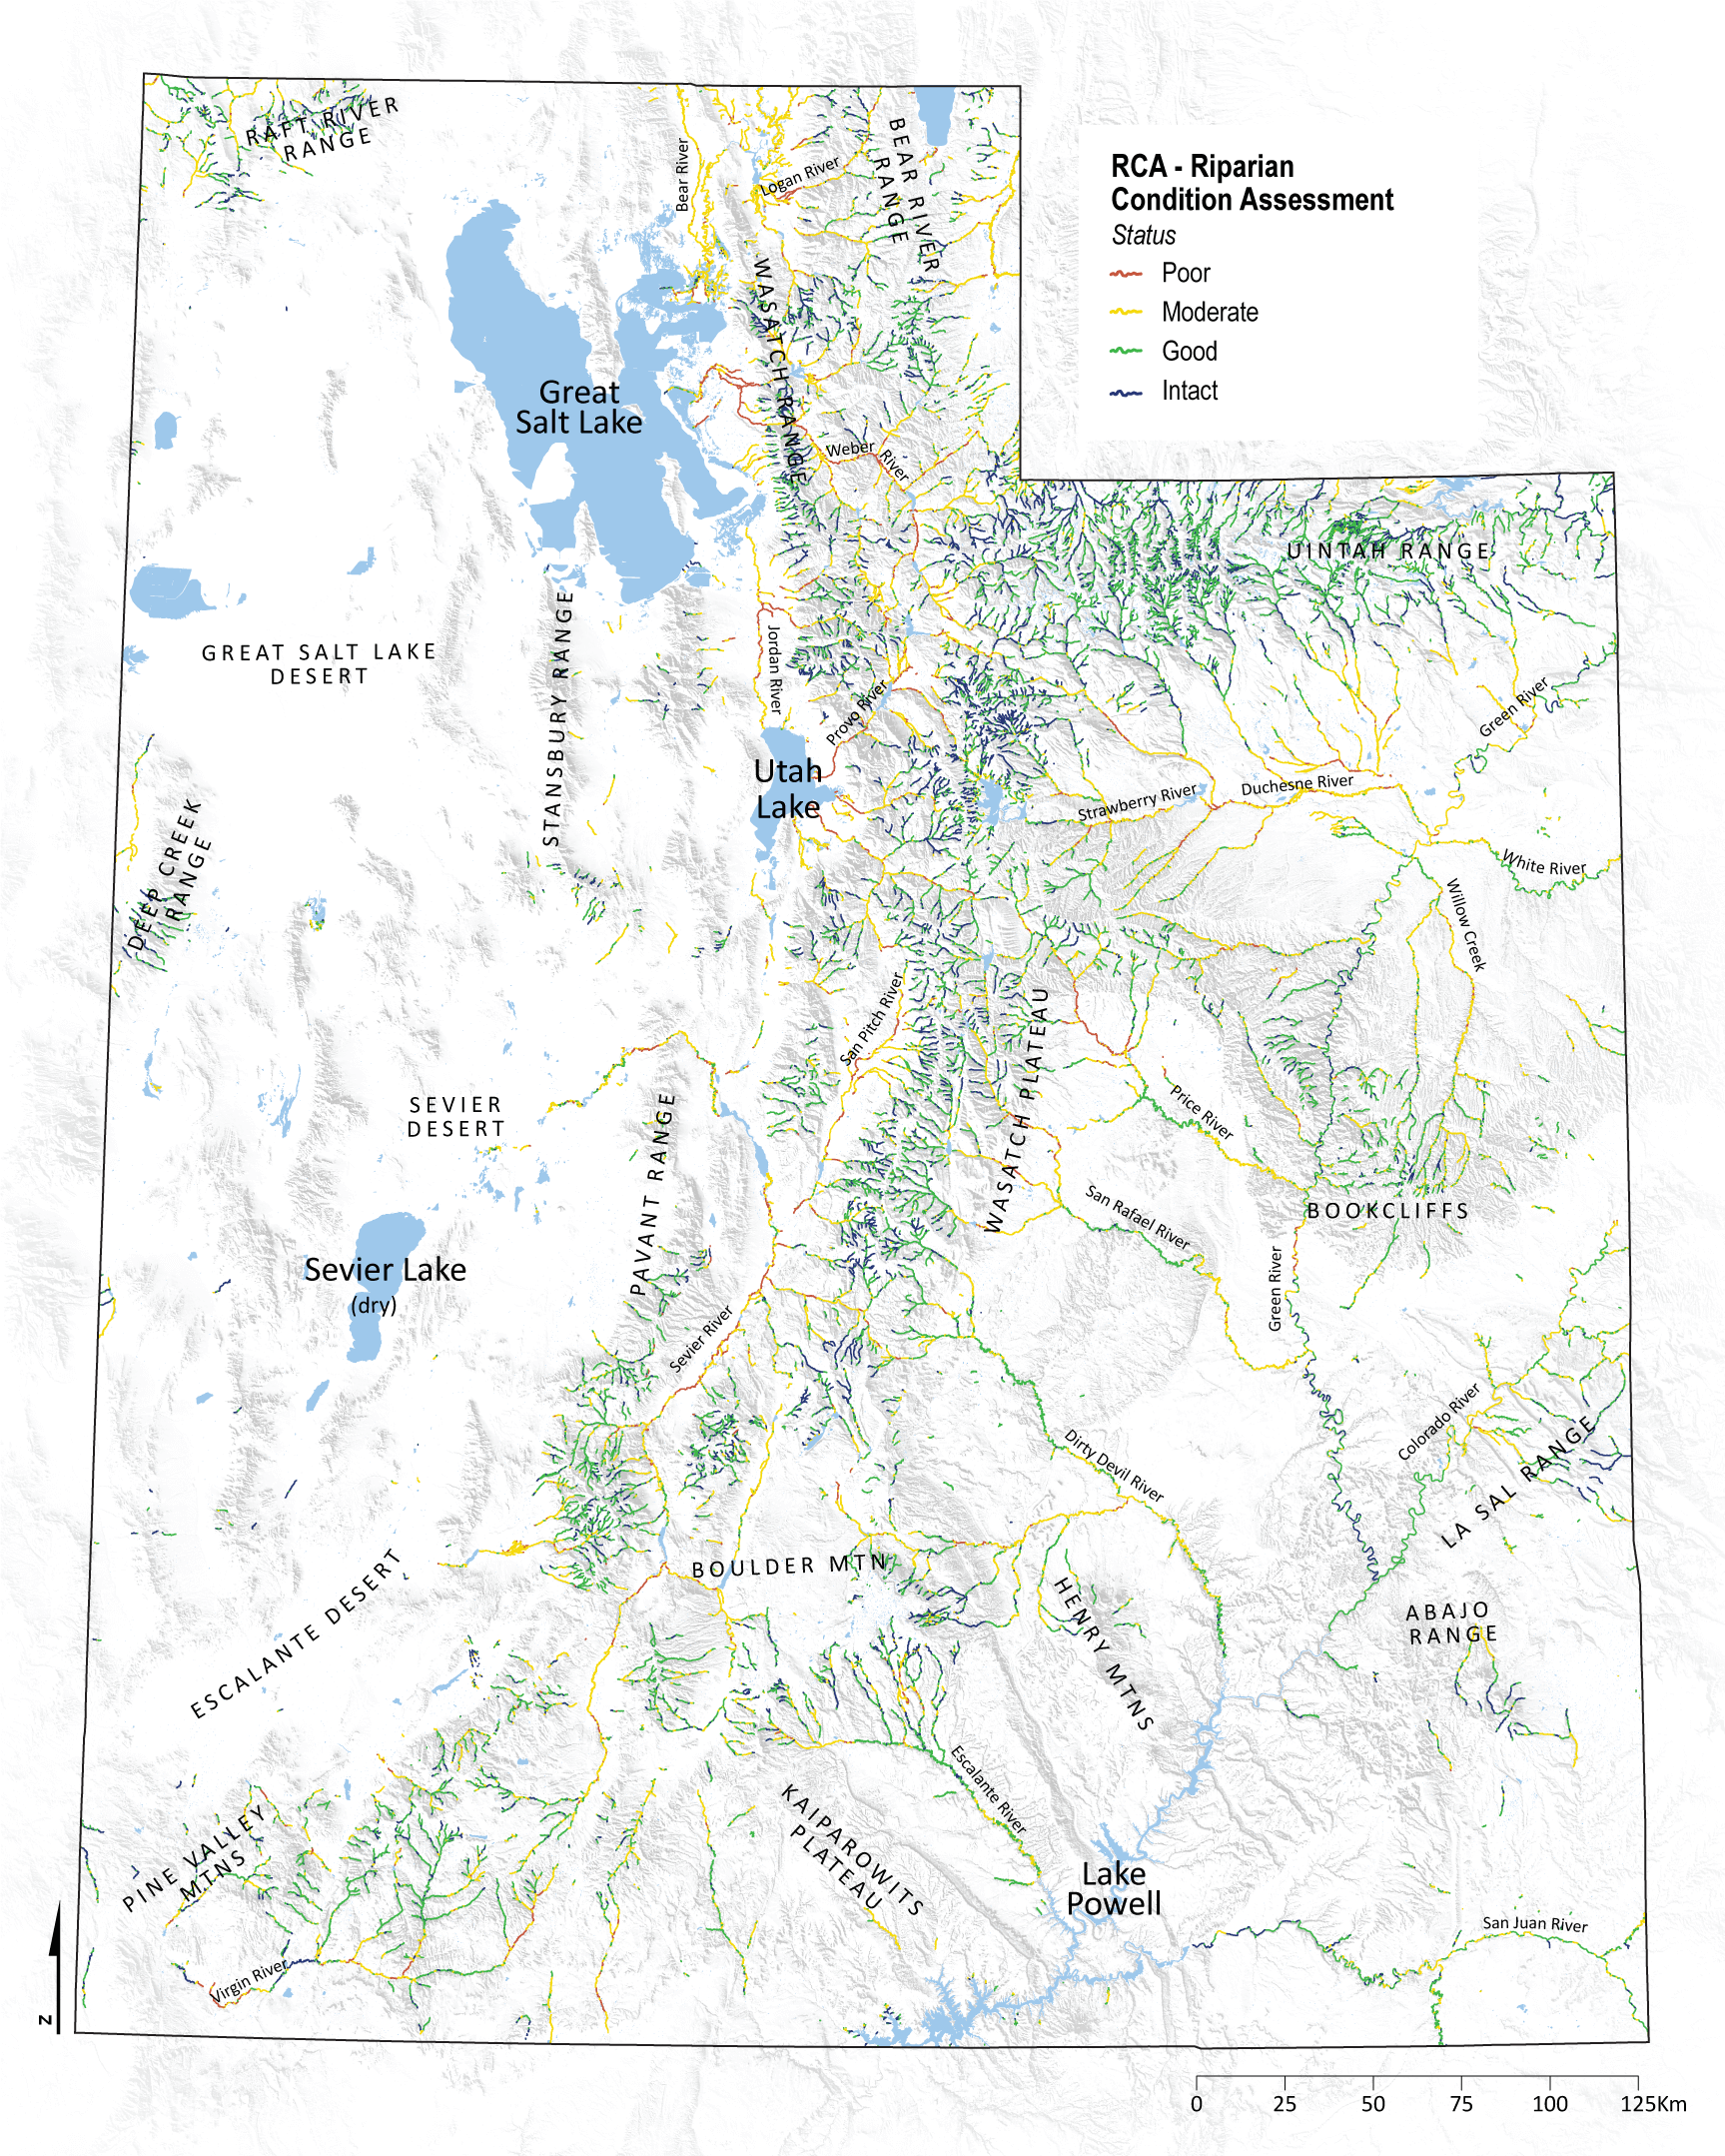
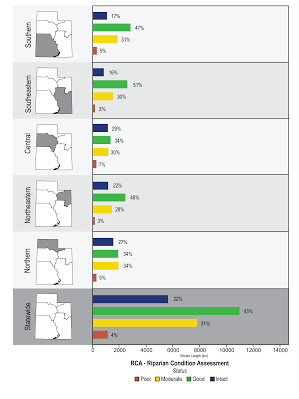
Figure 10 - Statewide Riparian Condition Assessment map (left) and bar chart (right).
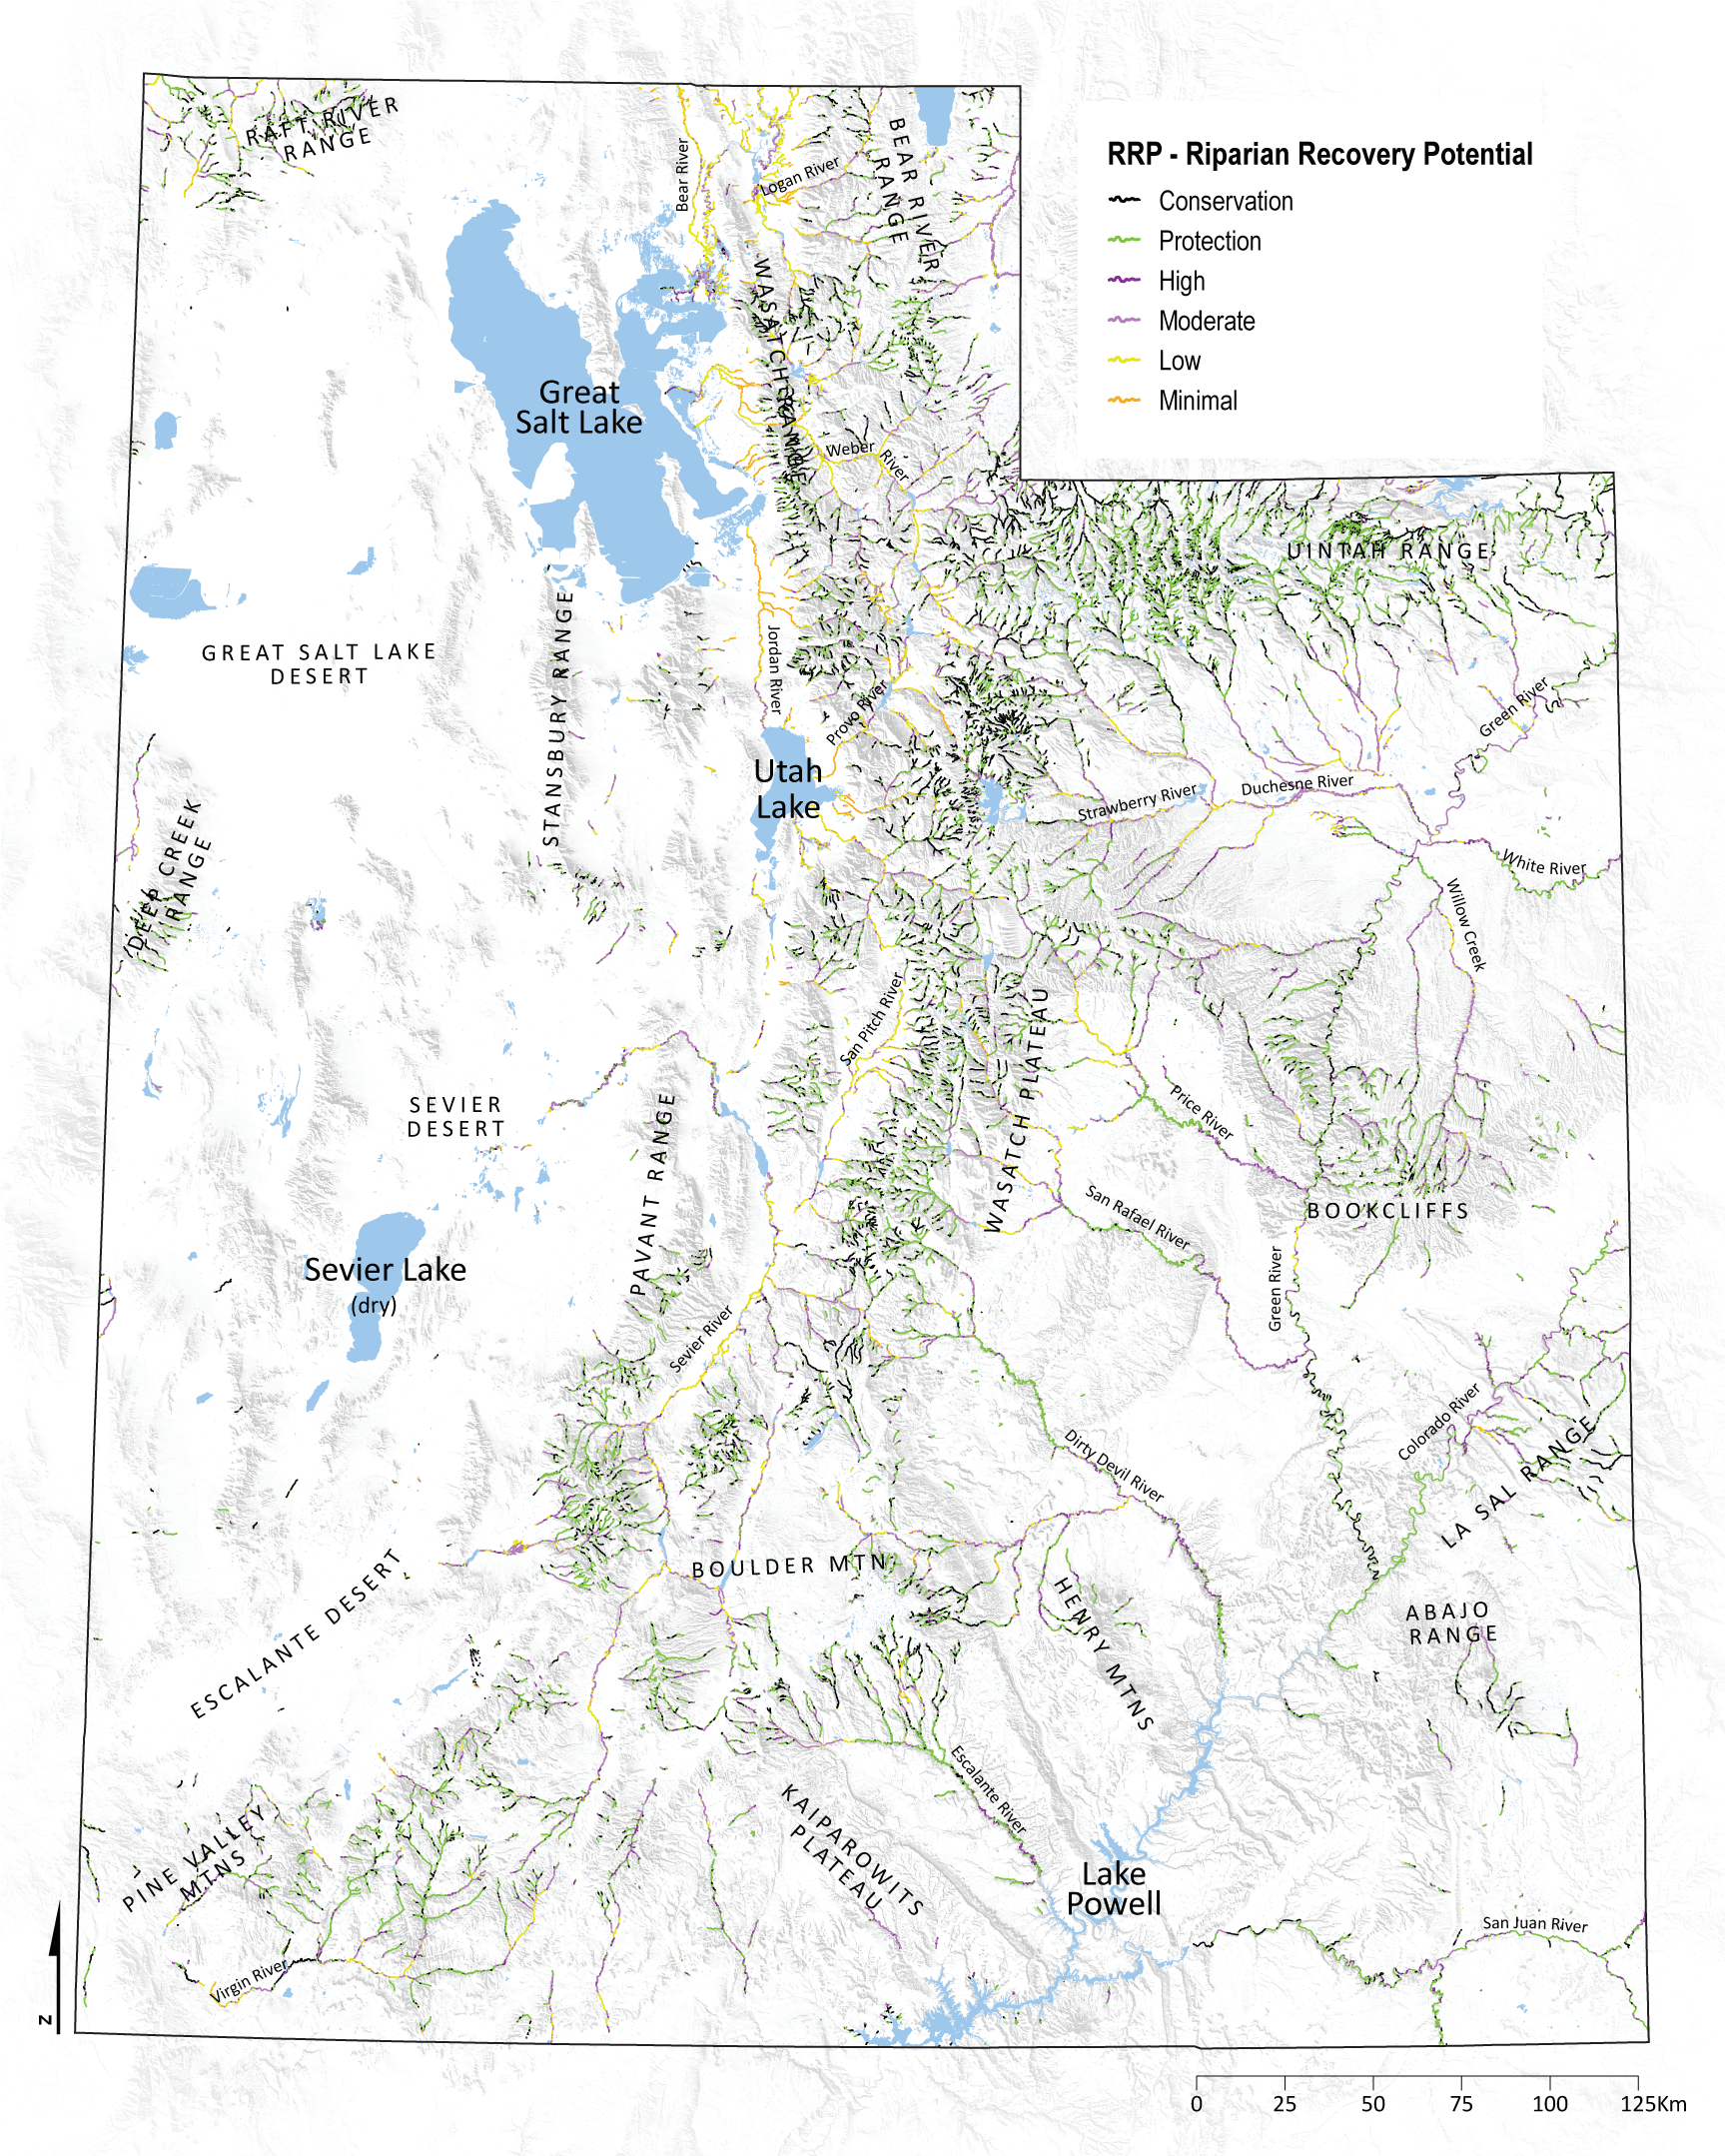
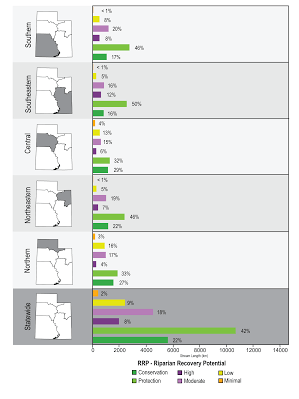
Figure 11 - Statewide Riparian Recovery Potential map (left) and bar chart (right).
Utah Statewide R-CAT Deliverable Data
R-CAT data for the initial statewide run for Utah can be downloaded manually from our Box Page
Utah-wide products for all perennial streams:
- Existing riparian vegetation delineation https://usu.box.com/ExistingVegetation
- Historic riparian vegetation delineation https://usu.box.com/v/RiparianVegetationDeparture
- Riparian Vegetation Departure https://usu.box.com/v/RiparianVegetationDeparture
- Riparian Vegetation Conversion Type https://usu.box.com/RiparianVegetationConversion
- Riparian Condition Assessment https://usu.box.com/RiparianConditionAssessment
- Riparian Recovery Potential https://usu.box.com/RiparianRecoveryPotential
West Desert:
- Intermittent stream riparian area delineation https://usu.box.com/IntermittentValleyBottoms
- Intermittent stream Riparian Vegetation Departure https://usu.box.com/IntermittentRiparianDeparture
- Intermittent stream Riparian Vegetation Conversion Type https://usu.box.com/IntermittentConversionType
- Intermittent stream Riparian Condition Assessment https://usu.box.com/IntermittentRiparianCondition
- Intermittent stream Riparian Recovery Potential https://usu.box.com/IntermittentRecoveryPotential
Weber River:
- Independent assessment of riparian/geomorphic condition and recovery potential using a River Styles Framework. PDF of Weber River Styles Report also available at https://usu.box.com/RiverStyles
From Databasin.org:
- Statewide V-BET with waterbodies - Perennial Valley Bottoms including lakes and reservoirs
- Statewide V-BET - Valley bottoms of perennial streams and rivers
- Statewide RVD - Riparian Vegetation Departure
- Statewide RVCT- Riparian Vegetation Conversion Type
- Statewide RCA - Riparian Condition Assessment
- Statewide RRP - Riparian Recovery Potential
Spatial Resolution
While high resolution imagery and topography are sometimes available, they are not available uniformly across the state of Utah, require much more computation and analysis time to use and do not necessarily always produce more accurate results. A guiding principle in this project has been to start simple, see how far nationally available datasets can get us, but develop pragmatic and extendable workflows that will be equally applicable with higher resolution inputs.
More Products:
References
- Brierley, G. and Fryirs, K., 2005. Geomorphology and River Management: Applications of the River Styles Framework. Blackwell Publishing, Victoria, Australia, 398 pp.
- Camp, R., 2015. Short Term Effectiveness of High Density Large Woody Debris in Asotin Creek as a Cheap and Cheerful Restoration Action. MS Thesis, Utah State University.
- O’Brien, G. and Wheaton, J.M., 2015. River Styles Report for the Middle Fork John Day Watershed, Oregon - Example Report for Exploring Leveraging the River Styles Framework in Tributary Habitat Management for the Columbia River Basin, Ecogeomorphology and Topographic Analysis Lab, Utah State University, Prepared for Eco Logical Research and the Bonneville Power Administration, Logan, UT.
- Portugal, E.W., Wheaton, J.M., Bouwes, N., 2015. Pine Creek Watershed Scoping Plan for Restoration. Prepared for the Confederated Tribes of Warm Springs, Logan, UT.